Java Performance 2nd Edition, Chapter 5, 6 Garbage Collection
Chapter 5. An Introduction to Garbage Collection
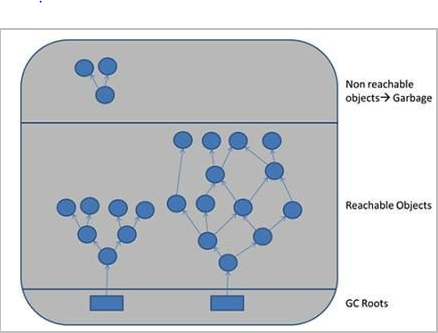
the GC algorithm scans all objects that are reachable via one of the root objects. Objects that are reachable via a GC root are live objects; the remaining unreachable objects are garbage
引用:Garbage Collection in Java - w3resource
GC RootsはHeap内に生成されたオブジェクトに対するRefarenceをもっているオブジェクト。GC RootsがRefarenceを持っていないオブジェクトがGC対象になる。
GC Rootsには主に4種類あって、
- local variable
- active threads
- static variables
- JNI references
the performance of GC is dominated by these basic operations: finding unused objects, making their memory available, and compacting the heap

図があるとわかりやすい。
The pauses when all application threads are stopped are called stop-the-world pauses. These pauses generally have the greatest impact on the performance of an application
GC Threadが走って、Memory内のオブジェクトを移動するとき(上の図でいうCompaction)にGC以外の稼働中のThreadがオブジェクト参照できない時間が発生する。
the phase where they scan for unused objects can occur without stopping application threads, these algorithms are called concurrent collectors.
stop-the-worldを必要としないのは魅力的だが、トレードオフとしてconcurrent collectorsはCPUコストが高いのでシステム全体のパフォーマンスを下げる。
GC Algorithms
| GC Algorithms | Description | Pro | Con | flag | |
|---|---|---|---|---|---|
| Serial GC |
Uses single thread to process the heap Suitable for one CPU environment |
Suitable for Docker containers | Stops application for both minor and full GC | -XX:+UseSerialGC | |
| Throughput(Parallel) GC |
Uses multiple thread to collect the young generation. Default GC in JDK 8 |
Minor GC is faster than serial | Stops application for both minor and full GC | -XX:+UseParallelGC | |
| G1 GC |
Concurrent collection. It collects area with high garabage density first Default GC from JDK 11 |
minimum application pause
|
It uses CPU resources | -XX:+UseG1GC | |
| CMS Collector |
Concurrent collection Depricated in JDK 11 Not recommended |
Memory will be fragmented It stops application if memory is fragmented |
-XX:+UseConcMarkSweepGC | ||
| ZGC | Experimental GC |
-XX:+UnlockExperimentalVMOptions -XX:+UseZGC |
|||
| Shenandoah | Experimental GC |
-XX:+UnlockExperimentalVMOptions -XX:+UseShenandoahGC |
|||
| Epsilon GC |
No Collection Suitable for very short-lived programs |
-XX:+UnlockExperimentalVMOptions -XX:+UseEpsilonGC |
Sizing the Heap
simply specifying a very large heap isn’t necessarily the answer either. The time spent in GC pauses is dependent on the size of the heap, so as the size of the heap increases, the duration of those pauses also increases.
Heapサイズを増やすだけでもパフォーマンステストは実施した方がよさそう。
Useful commands
-Xmx : Specify heap
-XX:NewRatio= N : Set the ration of young generation to the old generation
-XX:-UseAdaptiveSizePolicy : (true by default) dynamnically configuare size of heap, the generations, and the survivor spaces to find optimal performance.
Enabling GC Logging in JDK 8
-verbose:gc : Create a simple GC logs
-XX:+PrintGCDetails : (false by default) adds more details to GC lgos
-XX:+PrintGCTimeStamps : adds timestamps to each GC timing
GC logs are the key piece of data required to diagnose GC issues; they should be collected routinely (even on production servers).
Chapter 6. Garbage Collection Algorithms
Adaptive and Static Heap Size Tuning
As the heap size is increased, the throughput rapidly increases—until the heap size is set to 1,500 MB

上のグラフはadaptive sizingがdisableになっている。
1500MB heap sizeが常に正解ではないだろうけど、Heapを増やすこと得られるPerformance Gainはどのアプリも上限値がある。HeapサイズのSweet Spotを探す時参考になりそう。Heapを増やしすぎてTPSが落ちるのはGC時のPause-timeが増えるせい。
Adaptive sizing in the throughput collector will resize the heap (and the generations) in order to meet its pause-time goals. Those goals are set with these flags:
-XX:MaxGCPauseMillis=Nand-XX:GCTimeRatio=N
役に立ちそうなコマンドなのでメモ。MaxGCPauseMillisの値が小さくなれば必然とHeap Sizeも小さくなるリ、GC頻度も上がる。
GCTimeRatioはDefaultでは99が入っている、つまり99%の時間はアプリの処理に使って1%の時間はGCに使う、でもGCTimeRatioはPercentageではないので注意が必要。

Tuning G1 GC
concurrent marking of G1 GC to be in a race with the application threads: G1 GC must clear out the old generation faster than the application is promoting new data into it.
G1 GCのメモリー解放スピードがアプリがメモリー書き込みスピードに追いつけない場合、-XX:ParallelGCThreads= N の値を増やすことFull GCを回避することができる。ただしCPUリソースを使うのでFree Lunchではない。
G1 GC can also win its race if it starts the background marking cycle earlier. That cycle begins when the heap hits the occupancy ratio specified by
-XX:InitiatingHeapOccupancyPercent=N, which has a default value of 45.
InitiatingHeapOccupancyPercet この値のPercentはHeap全体のPercent. この値でC1 GCが走る頻度を決めることができる。値が小さ過ぎればFull GCを回避できる確率は増えるが、GC頻度が高くなりシステム全体のパフォーマンスは劣化する。なのでFull GCが起きない最大の値を設定するのがベスト。