5.1.3 Detecting regressions and limiting debugging
A passing unit test suite confirms that your code works and gives you the confidence to modify your existing code, either for refactoring or to add and modify new features.
コードに手を加える際の自信は結局は調査工数の削減にもなるのではと思う。
5.1.6 Documenting expected behavior
unit tests match the production code, they must be up to date, unlike other forms of documentation
ドキュメントとしてのテストという発想は自分の中では無かったので新しい発見。
6 Test quality
Test coverage can ensure some of the quality of your programming, but it is also a controversial metric. High code coverage does not tell you anything about the quality of the tests. A good programmer should be able to see beyond the pure percentage obtained by running tests.
6.2.1 Understanding that public APIs are contracts
Imagine a public method that takes a distance as a double parameter and uses a black-box test to verify a computation. At some point, the meaning of the parameter changes from miles to kilometers. Your code still compiles, but the runtime breaks. Without a unit test to fail and tell you what is wrong, you may spend a lot of time debugging and talking to angry customers.
To write testable code, you should reduce dependencies as much as possible. If your classes depend on many other classes that need to be instantiated and set up with some state, your tests will be very complicated
この問題に対するSolution
before
class Vehicle {
Driver d = new Driver();
boolean hasDriver = true;
privatevoid setHasDriver(boolean hasDriver) {
this.hasDriver = hasDriver;
}
}
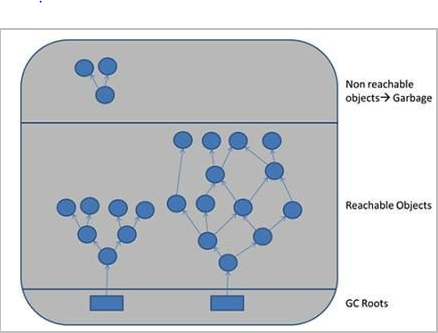
the GC algorithm scans all objects that are reachable via one of the root objects. Objects that are reachable via a GC root are live objects; the remaining unreachable objects are garbage
the performance of GC is dominated by these basic operations: finding unused objects, making their memory available, and compacting the heap
図があるとわかりやすい。
The pauses when all application threads are stopped are called stop-the-world pauses. These pauses generally have the greatest impact on the performance of an application
Uses multiple thread to collect the young generation.
Default GC in JDK 8
Minor GC is faster than serial
Stops application for both minor and full GC
-XX:+UseParallelGC
G1 GC
Concurrent collection.
It collects area with high garabage density first
Default GC from JDK 11
minimum application pause
It uses CPU resources
-XX:+UseG1GC
CMS Collector
Concurrent collection
Depricated in JDK 11
Not recommended
Memory will be fragmented
It stops application if memory is fragmented
-XX:+UseConcMarkSweepGC
ZGC
Experimental GC
-XX:+UnlockExperimentalVMOptions
-XX:+UseZGC
Shenandoah
Experimental GC
-XX:+UnlockExperimentalVMOptions
-XX:+UseShenandoahGC
Epsilon GC
No Collection
Suitable for very short-lived programs
-XX:+UnlockExperimentalVMOptions
-XX:+UseEpsilonGC
Sizing the Heap
simply specifying a very large heap isn’t necessarily the answer either. The time spent in GC pauses is dependent on the size of the heap, so as the size of the heap increases, the duration of those pauses also increases.
Heapサイズを増やすだけでもパフォーマンステストは実施した方がよさそう。
Useful commands
-Xmx : Specify heap
-XX:NewRatio= N : Set the ration of young generation to the old generation
-XX:-UseAdaptiveSizePolicy : (true by default) dynamnically configuare size of heap, the generations, and the survivor spaces to find optimal performance.
Enabling GC Logging in JDK 8
-verbose:gc : Create a simple GC logs
-XX:+PrintGCDetails : (false by default) adds more details to GC lgos
-XX:+PrintGCTimeStamps : adds timestamps to each GC timing
GC logs are the key piece of data required to diagnose GC issues; they should be collected routinely (even on production servers).
Chapter 6. Garbage Collection Algorithms
Adaptive and Static Heap Size Tuning
As the heap size is increased, the throughput rapidly increases—until the heap size is set to 1,500 MB
Adaptive sizing in the throughput collector will resize the heap (and the generations) in order to meet its pause-time goals. Those goals are set with these flags: -XX:MaxGCPauseMillis=N and -XX:GCTimeRatio=N
concurrent marking of G1 GC to be in a race with the application threads: G1 GC must clear out the old generation faster than the application is promoting new data into it.
G1 GCのメモリー解放スピードがアプリがメモリー書き込みスピードに追いつけない場合、-XX:ParallelGCThreads= N の値を増やすことFull GCを回避することができる。ただしCPUリソースを使うのでFree Lunchではない。
G1 GC can also win its race if it starts the background marking cycle earlier. That cycle begins when the heap hits the occupancy ratio specified by -XX:InitiatingHeapOccupancyPercent=N, which has a default value of 45.
We have two conflicting goals here. The first general rule is to create objects sparingly and to discard them as quickly as possible. Using less memory is the best way to improve the efficiency of the garbage collector. On the other hand, frequently re-creating some kinds of objects can lead to worse overall performance (even if GC performance improves)
The size of an object can be decreased by (obviously) reducing the number of instance variables it holds and (less obviously) by reducing the size of those variables.
Object Reuse
objects that are reused stay around for a long time in the heap. If the heap has a lot of objects, there is less room to create new objects, and hence GC operations will occur more frequently.
The length of time it takes to perform a full GC is proportional to the number of objects that are still alive in the old generation.
Objectの再利用によってパフォーマンスが向上するケースは限定的。connection pool やinitializeコストが大きいオブジェクトをpoolingして再利用するのは有効。
Unix-like operating systems including Linux and BSD have a monolithic kernel that manages CPU scheduling, memory, file systems, network protocols, and system devices
Since mode and context switches cost a small amount of overhead (CPU cycles),3 there are various optimizations to avoid them, including:
User-mode syscalls: It is possible to implement some syscalls in a user-mode library alone. The Linux kernel does this by exporting a virtual dynamic shared object (vDSO) that is mapped into the process address space, which contains syscalls such as gettimeofday(2) and getcpu(2) [Drysdale 14].
Kernel bypass: This allows user-mode programs to access devices directly, bypassing syscalls and the typical kernel code path. For example, DPDK for networking: the Data Plane Development Kit.
A commonly used scheduling policy dating back to UNIX identifies CPU-bound workloads and decreases their priority, allowing I/O-bound workloads—where low-latency responses are more desirable—to run sooner.
時間がかかるCPU-bound workloadsを後回しにするのか、意外。
3.4 Linux
Linux kernel developments, especially those related to performance, include the following
CPU scheduling classes: Various advanced CPU scheduling algorithms have been developed, including scheduling domains (2.6.7) to make better decisions regarding non-uniform memory access (NUMA)
TCP congestion algorithms: Linux allows different TCP congestion control algorithms to be configured, and supports Reno, Cubic, and more in later kernels mentioned in this list.
splice (2.6.17): A system call to move data quickly between file descriptors and pipes, without a trip through user-space.
For application performance, you can start with what operations the application performs (as described earlier) and what the goal for performance is. The goal may be:
Latency: A low or consistent application response time
Throughput: A high application operation rate or data transfer rate
Resource utilization: Efficiency for a given application workload
Price: Improving the performance/price ratio, lowering computing costs
One way to efficiently improve application performance is to find the most common code path for the production workload and begin by improving that.
あたりまえだけど、大事なところ。
5.2.2 Caching
Instead of always performing an expensive operation, the results of commonly performed operations may be stored in a local cache for future use. An example is the database buffer cache
Fibers: Also called lightweight threads, these are a user-mode version of threads where each fiber represents a schedulable program. The application can use its own scheduling logic to choose which fiber to run.
Performance, on the other hand, is often subjective. With performance issues, it can be unclear whether there is an issue to begin with, and if so, when it has been fixed. What may be considered “bad” performance for one user, and therefore an issue, may be considered “good” performance for another.
An effective visualization of CPU profiles is flame graphs. CPU flame graphs can help you find more performance wins than any other tool, after metrics.
Bottleneck: In systems performance, a bottleneck is a resource that limits the performance of the system. Identifying and removing systemic bottlenecks is a key activity of systems performance.
The performance of a system under test (SUT) is shown in Figure 2.1.
Figure 2.1 Block diagram of system under test
It is important to be aware that perturbations (interference) can affect results, including those caused by scheduled system activity, other users of the system, and other workloads.
When the potential ROI is less than the cost of analysis. Some performance issues I work on can deliver wins measured in tens of millions of dollars per year. For these I can justify spending months of my own time (engineering cost) on analysis.
自分の時間(eninering cost)と成果物が釣り合ってるのかもっと考えないといけない。
2.3.9 Scalability
Figure 2.7 Performance degradation
Higher response time is, of course, bad. The “fast” degradation profile may occur for memory load, when the system begins moving memory pages to disk to free main memory. The “slow” degradation profile may occur for CPU load.
なるほどー。覚えておこう。
Overhead
Performance metrics are not free; at some point, CPU cycles must be spent to gather and store them. This causes overhead, which can negatively affect the performance of the target of measurement. This is called the observer effect.
二重スリット実験を思い出す。見るとはpassiveではなくactive.
2.3.15 Known-Unknowns
Known-knowns: These are things you know. You know you should be checking a performance metric, and you know its current value. For example, you know you should be checking CPU utilization, and you also know that the value is 10% on average.
Known-unknowns: These are things you know that you do not know. You know you can check a metric or the existence of a subsystem, but you haven’t yet observed it. For example, you know you could use profiling to check what is making the CPUs busy, but have yet to do so.
Unknown-unknowns: These are things you do not know that you do not know. For example, you may not know that device interrupts can become heavy CPU consumers, so you are not checking them